



Skip to main content Skip to main navigation
Australian Public Service Academy Australian Public Service Academy Australian Public Service Academy Australian Public Service Academy logo

APSLearn logo

APSLearn Login

APS Professions logo
Professions MCP Portal

Main navigation

  • APS Craft

    APS Craft

    • Integrity
    • Working in Government
    • Engagement & Partnership
    • Implementation & Services
    • Strategy, Policy & Evaluation
    • Leadership & Management
  • APS Professions

    APS Professions

    • Complex Project Management Profession
    • Data Profession
    • Digital Profession
    • Evaluation Profession
    • HR Profession
    • Procurement and Contract Management Profession
  • APS People

    APS People

    • Diversity and Inclusion
    • Health and Wellbeing
    • Work Health and Safety
    • Your APS Career
  • APS Induction
  • Learning Experiences

    Learning Experiences

    • Courses
    • Course session dates
    • Microcredentials
    • Events
    • Resources
    • Cross Agency Training Hub
    • Nationwide course sessions
    • SES Executive Coaching
  • Our Services

    Our Services

    • APSLearn
    • APS Academy course offerings
    • APS Academy Training Venues
    • Onboard learning experiences
    • Share and reuse learning experiences
  • Guides

    Guides

    • APS L&D Good Practice Guide
    • Content Strategy Guide
  • News

    News

    • Academy News
    • MyAcademy
  • About us

    About us

    • About the APS Professions
    • Faculty
    • Learning approach
    • Contact
    • Supplier FAQ's

Show the content ecosystem

You are here

  1. Home
  2. Learning Experiences
  3. Resources
  4. Show the content ecosystem
  • Linkedin
  • Twitter
  • Facebook
  • Email
Print

Use a map or illustration to show the extent of your content ecosystem.

Your map will show how complex the ecosystem is and should point to any channel duplication. The map should only include channels. Leave actual content for the content audit stage.

Create a picture of the content ecosystem

Content ecosystems can be very complex. The clearest way to show complexity is with pictures rather than words. You can choose from a range of visual tools to show the ecosystem.

Mind maps

Mind maps are simple and quick and will show channel complexity and duplication.

Starting with your list of channels, draw a mind map. Draw lines to show the connections between channels.

This will show the state of your content ecosystem.

Complex ecosystem map

If your map shows channel duplication or an overly complex ecosystem, you need a content strategy.
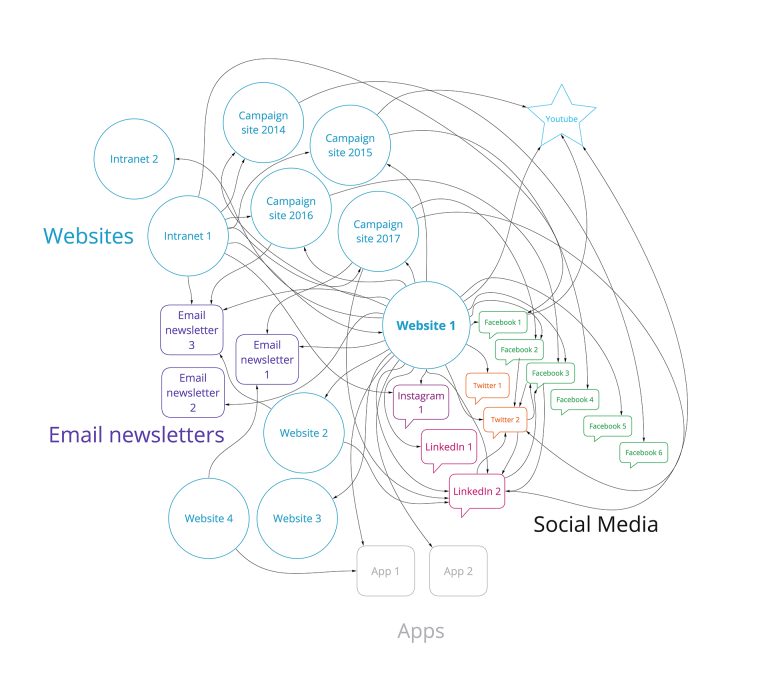
Diagram showing a complex digital ecosystem with websites, intranets, campaign sites, email newsletters, social media channels, apps and YouTube connected by numerous overlapping arrows. The visual illustrates how content and information flow between multiple platforms, highlighting interdependencies and the challenges of managing a large digital content environment.

This complex ecosystem map shows the main website at the centre, surrounded by four content channel types, websites, email newsletters, social media, and apps. The channels are interconnected in a complicated and confusing way, and there are many subsets with duplicate channels.

Clear ecosystem map

A good channel ecosystem has few channels and little duplication.

The ecosystem is clear and simple.
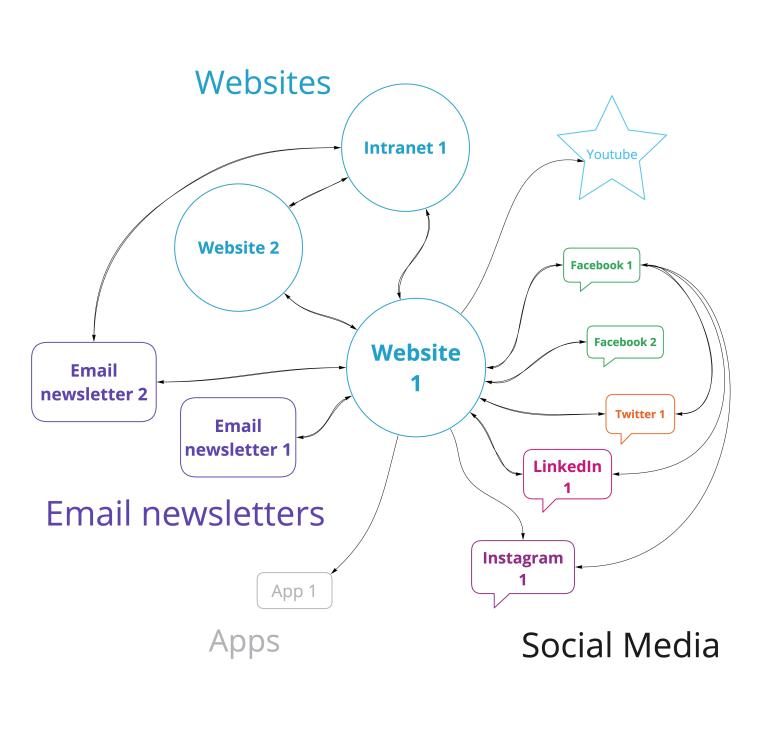
Simplified digital ecosystem map showing a central website connected to related channels including websites, intranet, email newsletters, social media platforms, apps and YouTube. Arrows illustrate content flows and relationships between channels, demonstrating a more streamlined and easier-to-manage content ecosystem.

This clear ecosystem map shows the main website at the centre, surrounded by four content channel types, websites, email newsletters, apps, and social media. There are just one or two subsets connected in a clear and simple way.

Venn diagrams

Venn diagrams are really useful for conveying overlap.

They can clearly show problems like multiple websites or departments producing the same content.
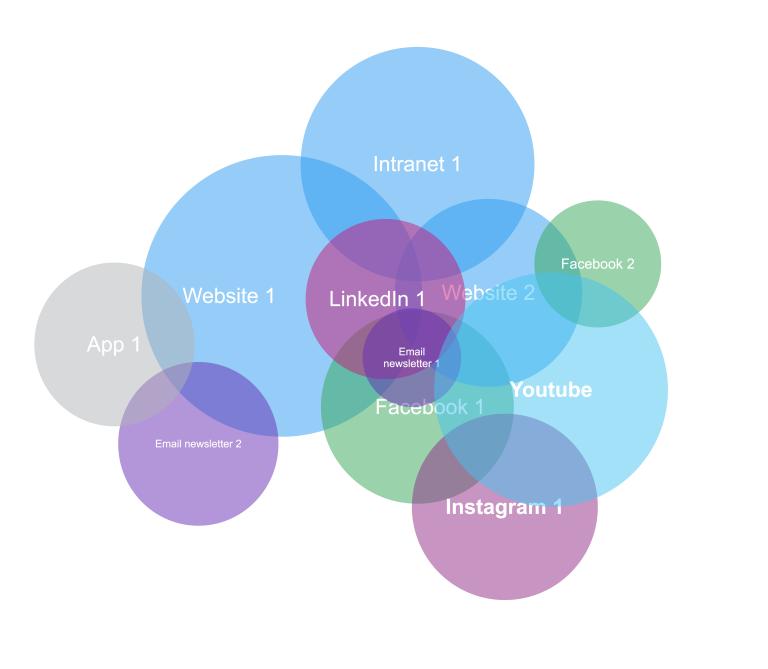
Venn diagram-style visual showing a digital content ecosystem as a series of overlapping circles representing websites, intranet, social media platforms, email newsletters and an app. The overlapping areas illustrate shared audiences, interconnected content and the relationships between different digital channels.

This Venn diagram is made up of circles of different sizes representing content channels. Some of the circles are overlapping, indicating that they might be producing duplicate content.

Screenshots

You can create a montage using screenshots of web pages and other channels to show duplicate channels. This is a simple, clear and fast way to present a complex content ecosystem.
 

L&D Section
Understand your content ecosystem
L&D Groups
Where to begin
L&D Categories
Content Strategy Guide
Was this page helpful?
Last updated
23 September 2026

Acknowledgement of Country

The APS Academy acknowledges the Traditional Custodians of Country throughout Australia and recognises the continuing connection to lands, waters and communities.
We pay our respect to Aboriginal and Torres Strait Islander cultures and to Elders both past and present.

Museum of Australian Democracy
Old Parliament House 
Parkes 2600

APSLearn terms & conditions

About us

apsacademy@apsc.gov.auContact us
ABN: 99 470 863 260 
  • LinkedIn - external site - external site - external site

Help us improve

We are always looking for ways to improve the user experience of our website

 Share your thoughts

  • © 2021 APS Academy. All rights reserved.
  • FOI
  • Privacy Policy 
  • Terms of use
  • Accessibility
Back to top